Submission and Input
(Input Options) The user can input their data either by uploading a structure file in
either .pdb or .cif format, or by providing an RCSB ID number in the
first input form. Specific chains may be selected or ignored
by entering them in the second input form as a comma separated list (case sensitive). If
invalid chains are entered the chain selection criteria will be ignored. By default ΔΔG
predictions are produced using Rosetta2.3.
Users can check "Skip ΔΔG Prediction" to disable
these predictions. ΔΔG predictions will be skipped for any structure greater than 1000 residues
in length. As an alternative to proline evaluations, a glycine scan can be performed in an analogous
manner to the proline prediction protocol by checking the "Run Glycine Scan"box

Output Page Navigation
(Download Options) After a run is successfully completed the user has the option to download the output for all residues (Download Full Results) or download the output for only the top scoring proline candidates (Download Highest Scoring Results).
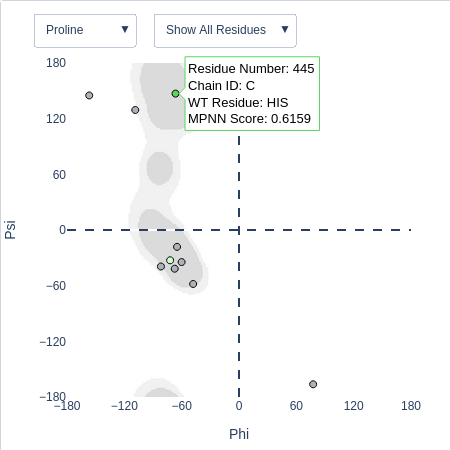
(Ramachandran Diagrams and Model Viewer) Beneath the download options a Ramachandran diagram displaying phi/psi coordinates
of all residues and a 3d model of the input structure are displayed. The user can filter the output for a target residue by entering
its chain name and ID into the input field in the top left corner. For example, inputting C445 will filter the output to residue 445
of chain C.
The Ramachandran Plot, 3d model, and rows of the results table use the following color scheme:
- Green: Residues with preferable or acceptable Ramachandran backbone angle for proline and a ProteinMPNN proline probability greater than or equal to 0.2
- Light Green: Residues with ProteinMPNN proline probability between 0.01 and 0.2
- Grey/Uncolored: Residues that have either poor Ramachandran backbone angles or ProteinMPNN probability below 0.1
- Dark Blue: Wild-type proline residues
(Results Table) Below the Ramachandran Plot and 3d model, results of the scan are shown in the form of an interactive table. By default the predictions for all residues are displayed, but best proline substitution candidates can be displayed on their own by clicking the Display Top button.


Ramachandran Diagrams and Model Viewer
(Ramachandran Diagrams) To aid in Backbone analysis, ProScan outputs a Ramachandran
diagram that displays the Phi/Psi coordinates for all residues. Hovering over individual residue data points will
display the wild-type residue type, residue number, and ProteinMPNN score for the respective residue. The user
has the option to hide wild-type proline residues or poor candidate residues via the right drop-down menu above the diagram.
The diagram includes a density
plot representing the acceptable angles for proline or pre-proline residues based on published phi/psi angle distributions
of existing high-resolution protein structures (Lovell et al. 2003). The user can switch between the proline contour plot (default) or pre-proline contour plots via the drop-down button in the left
drop-down menu above the diagram. The Pro_Angle and Pre-Pro_Angle criteria is based on the boundaries of this density plot and are defined by the following:
- Residues with backbone angles that fall within 98% of data (darker boundaries) are classified as "Preferable"
- Residues with backbone angles that fall within 99.95% of data (lighter boundaries) are classified as "Acceptable"
- Residues with backbone angles outside either boundary are classified as "Questionable"
(3d Model Viewer) A 3d model of input structure is displayed to the right of the Ramachandran Plot. Controls for viewing the model follow the default nglviewer control scheme. Residues are colored according to the scheme described in Output Page Navigation. Aditionally, all the atoms of the best and acceptable substitution candidates are displayed with a ball-and-stick representation.

Results Table Interpretation
(Results Table Layout) Both the downloaded results table and table displayed on the results page follow the same format:
| Column | Description |
|---|---|
| Residue | Identity of wild-type residue |
| ID | ID number of residue as defined by input |
| Chain | Chain of residue as defined by input |
| Phi | Phi angle of residue |
| Psi | Psi angle of residue |
| Sec Struct | Predicted secondary structure |
| ProteinMPNN Probability | Probability of residue being a proline according to ProteinMPNN output |
| Pro Angle | Ramachandran Plot classification according to where backbone angle falls in Lovell et al. proline angle distribution |
| Pre-Pro Angle | Ramachandran Plot classification according to where backbone angle of previous residue falls in Lovell et al. pre-pro angle distribution |
| Notes | Extra information related to effect of mutation such as disruption of hydrogen bonding (h-bonds located in the side chain or h-bonds where the donor is the main-chain nitrogen atom), disruption of a disulfide bond, or interruption of glycan binding (if input explicitly defines which residue glycan is bound to) |
(Results Table Control Options) The table found in the final results page can be manipulated by the user. Columns can be sorted alphabetically or numerically by clicking on the column headers. Clicking the header three times will restore the column to its original order. The user also has the option to search for specific values in each column by using the input form below the header of column. For example, to display only glycine residues enter "GLY" below the residue header. It is also possible to apply other filters using logical expression syntax. For example to exclude prolines enter "!PRO" below the Residue column header.